How to Debug Java Apps in Kubernetes Pods
Summary
This article shows how to get into a running pod like CloudDriver or Orca in debug mode, and as we execute certain actions via the Web GUI (Spinnaker Deck), we should be able to see the running code in our IntelliJ IDE to see what is happening under the hood. Also being able to see what arguments are being passed as users initiate actions, etc.
Goals
The goal is to have all the context which helps reproduce a bug which makes it easy to pinpoint the problem and find the root cause.
You can have multiple Intellij instances connected to different pods to be able to go through the whole sequence of actions executed in multiple pods to accomplish a task involving multiple pods.
Proposed Solution
The ideal way to pinpoint a bug in non-local environment is to be able to get into the running process and have the real context including inputs, databases, environment variables, volumes, etc.
Here are the steps to take to sneak into a running pod:
-
Make sure your kubectl context is connected to the right cluster.
Running the below command returns current cluster name, make sure it’s a non-production cluster.
kubectl config current-contextFor me it’s
gke_playground-272118_europe-west6-c_playground-cluster, yours is different. -
Find the pod you want to debug, run a command like this will list all the pod ids associated with a service, ideally it returns one id.
kubectl get pods | grep -i clouddriver | awk '{print $1}'You can check the status and details of pod by running
kubectl describe pod "$(kubectl get pods | grep clouddriver | awk '{print $1}')"If you take a close look there is a
JAVA_OPTSparameter passed to jvm on running main process of pod.What we need to do to be able to debug that process by adding debug parameters to JAVA_OPTS.
Peek into running pod by executing this command
kubectl exec -it "$(kubectl get pods | grep clouddriver | awk '{print $1}')" bashExecute
ps auxto check processes running in the pod. The jvm parameters will be revealed as well. For me output is: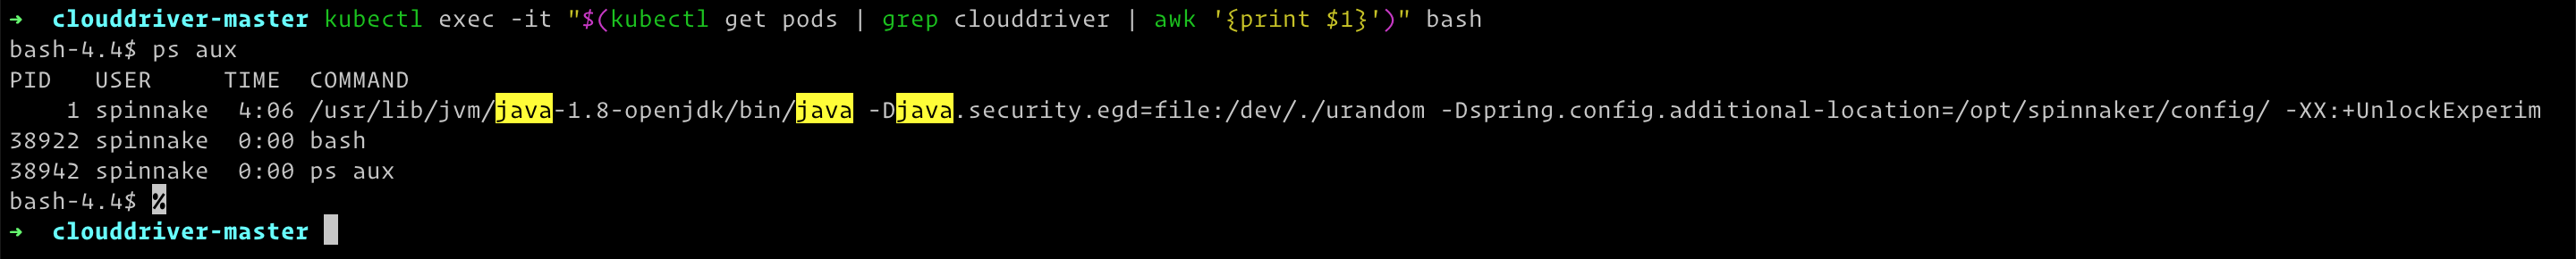
Get processes running inside the pod
-
You can edit the yaml definition of pod using your cloud provider GUI or you can use kubectl. I’ll describe both here, choose your preferred one.
-
GUI way
-
Find the deployment of CloudDriver and click Edit button to go to edit mode.
-
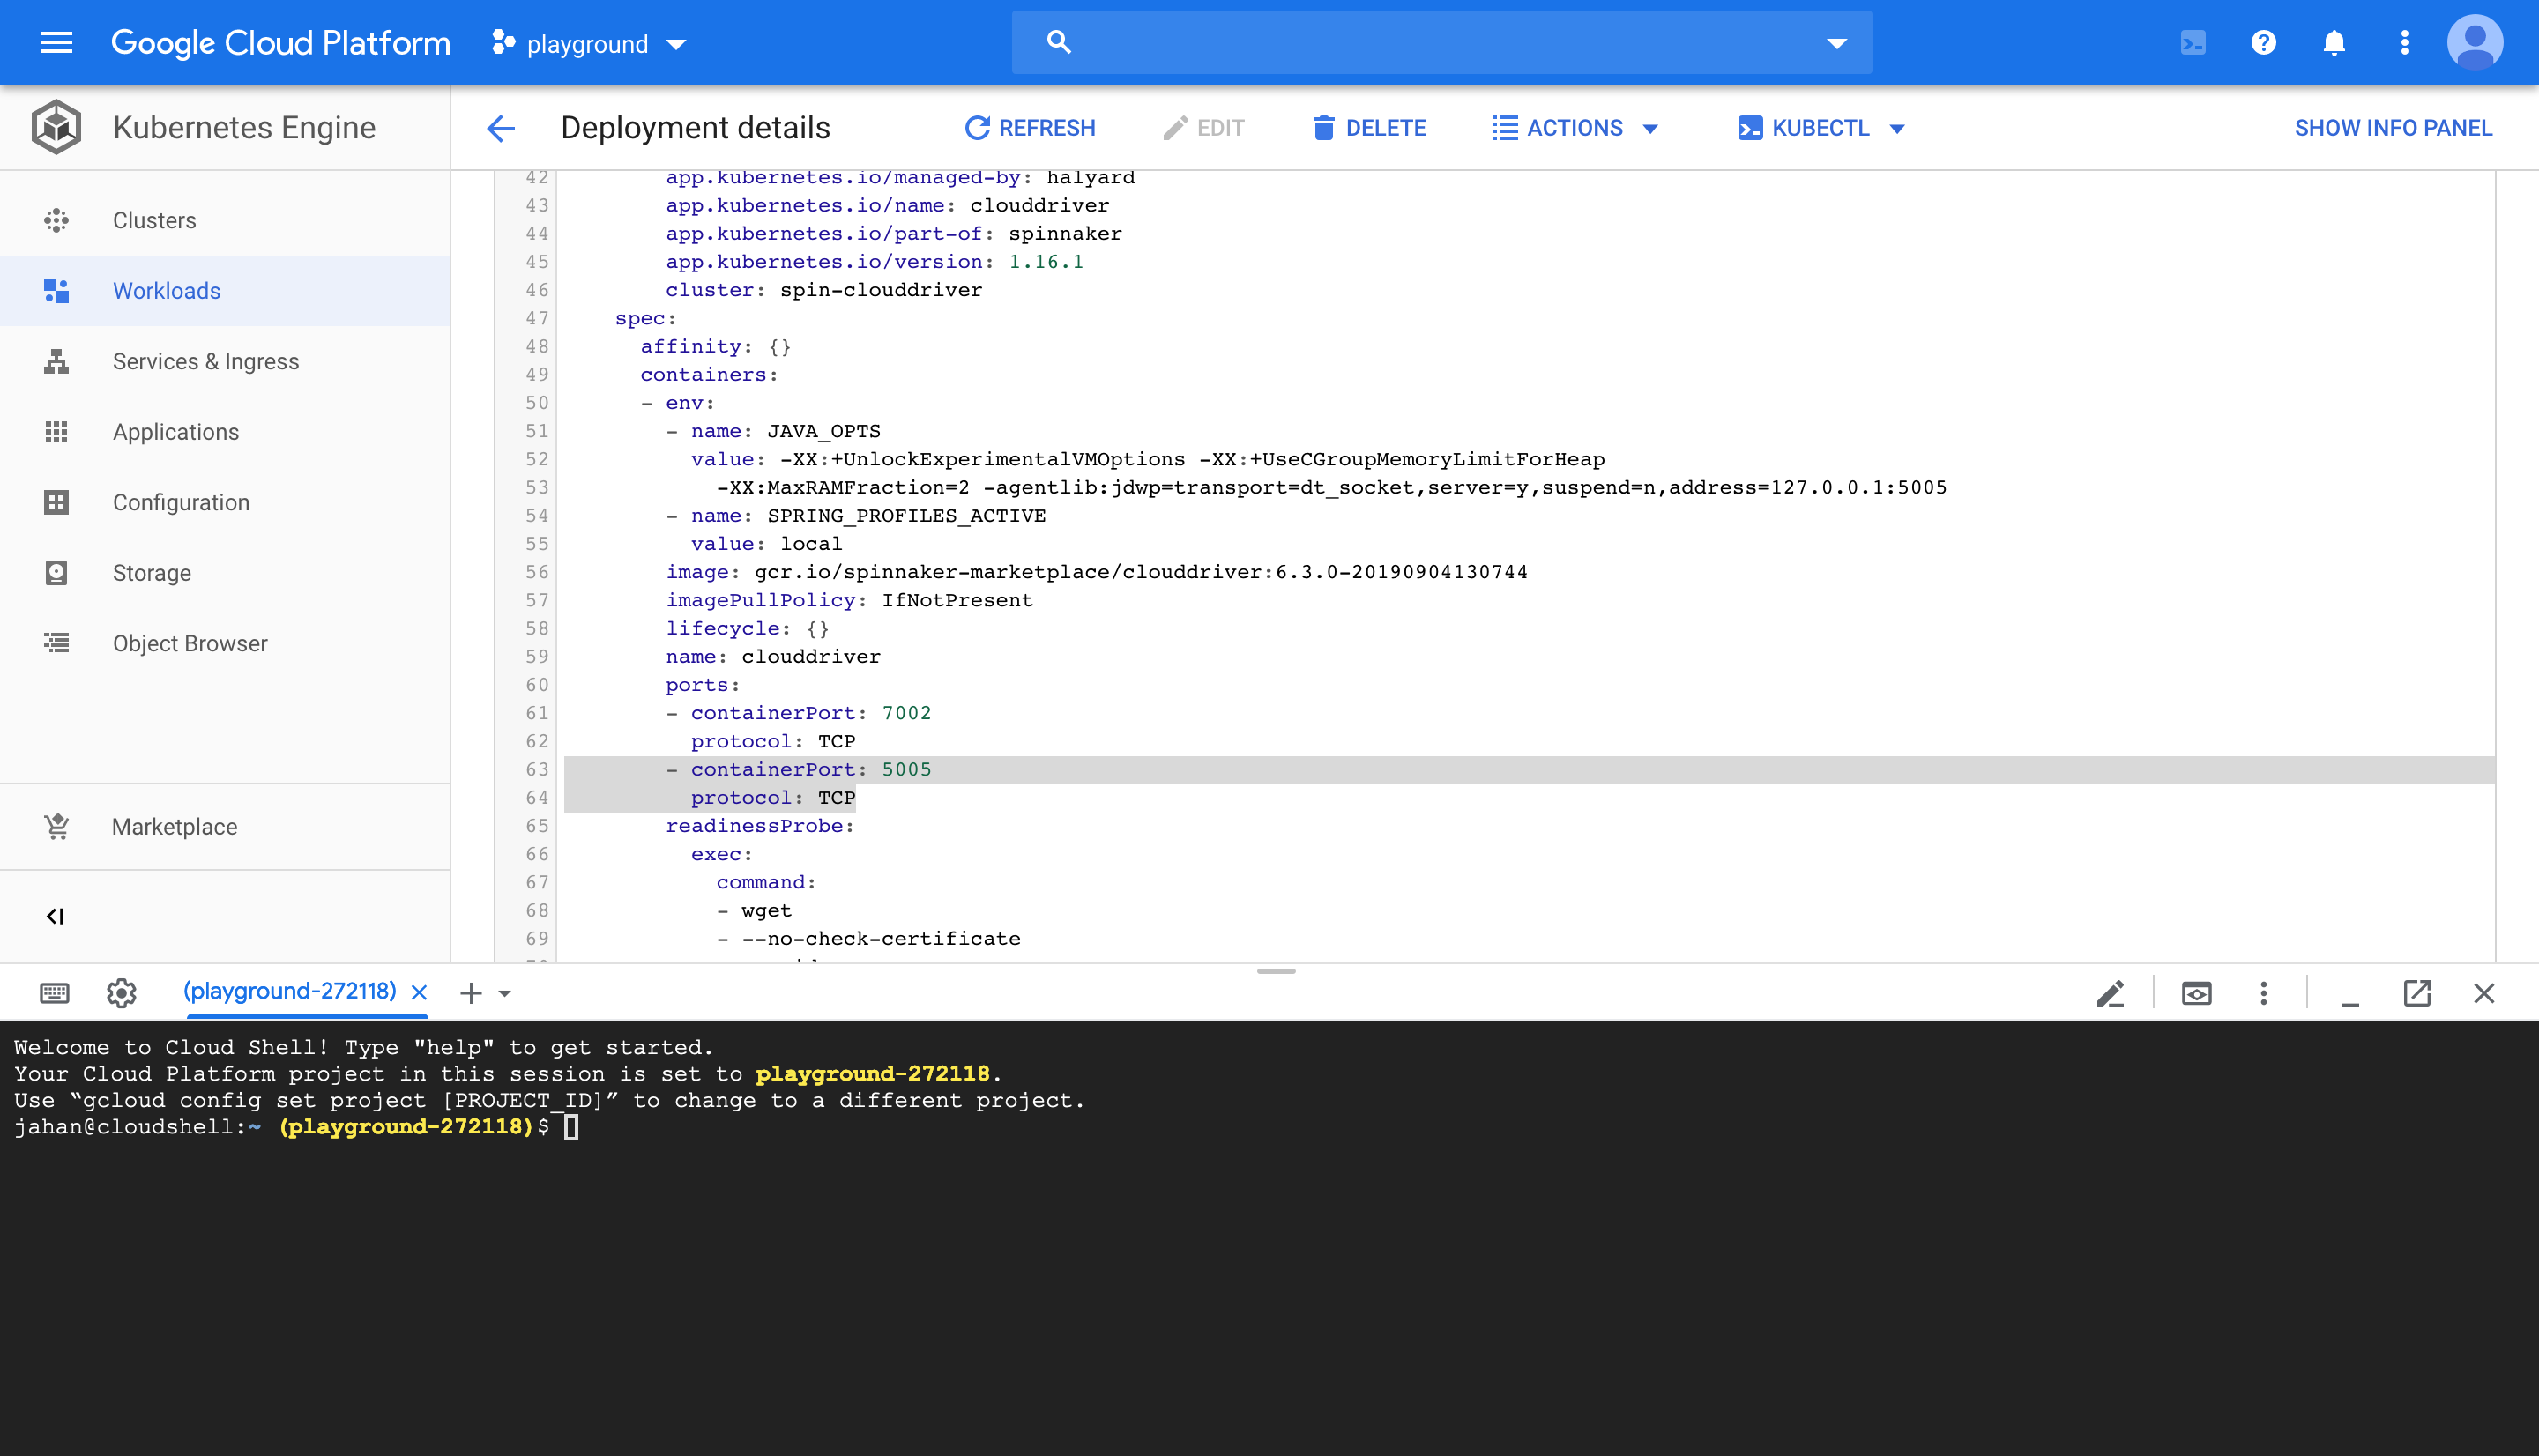
Append below arguments to java
-agentlib:jdwp=transport=dt_socket,server=y,suspend=n,address=127.0.0.1:5005You can replace 5005 with any other arbitrary free port number, you are required to change it e.g. to 5006 all across the guide in case of debugging multiple pods.
-
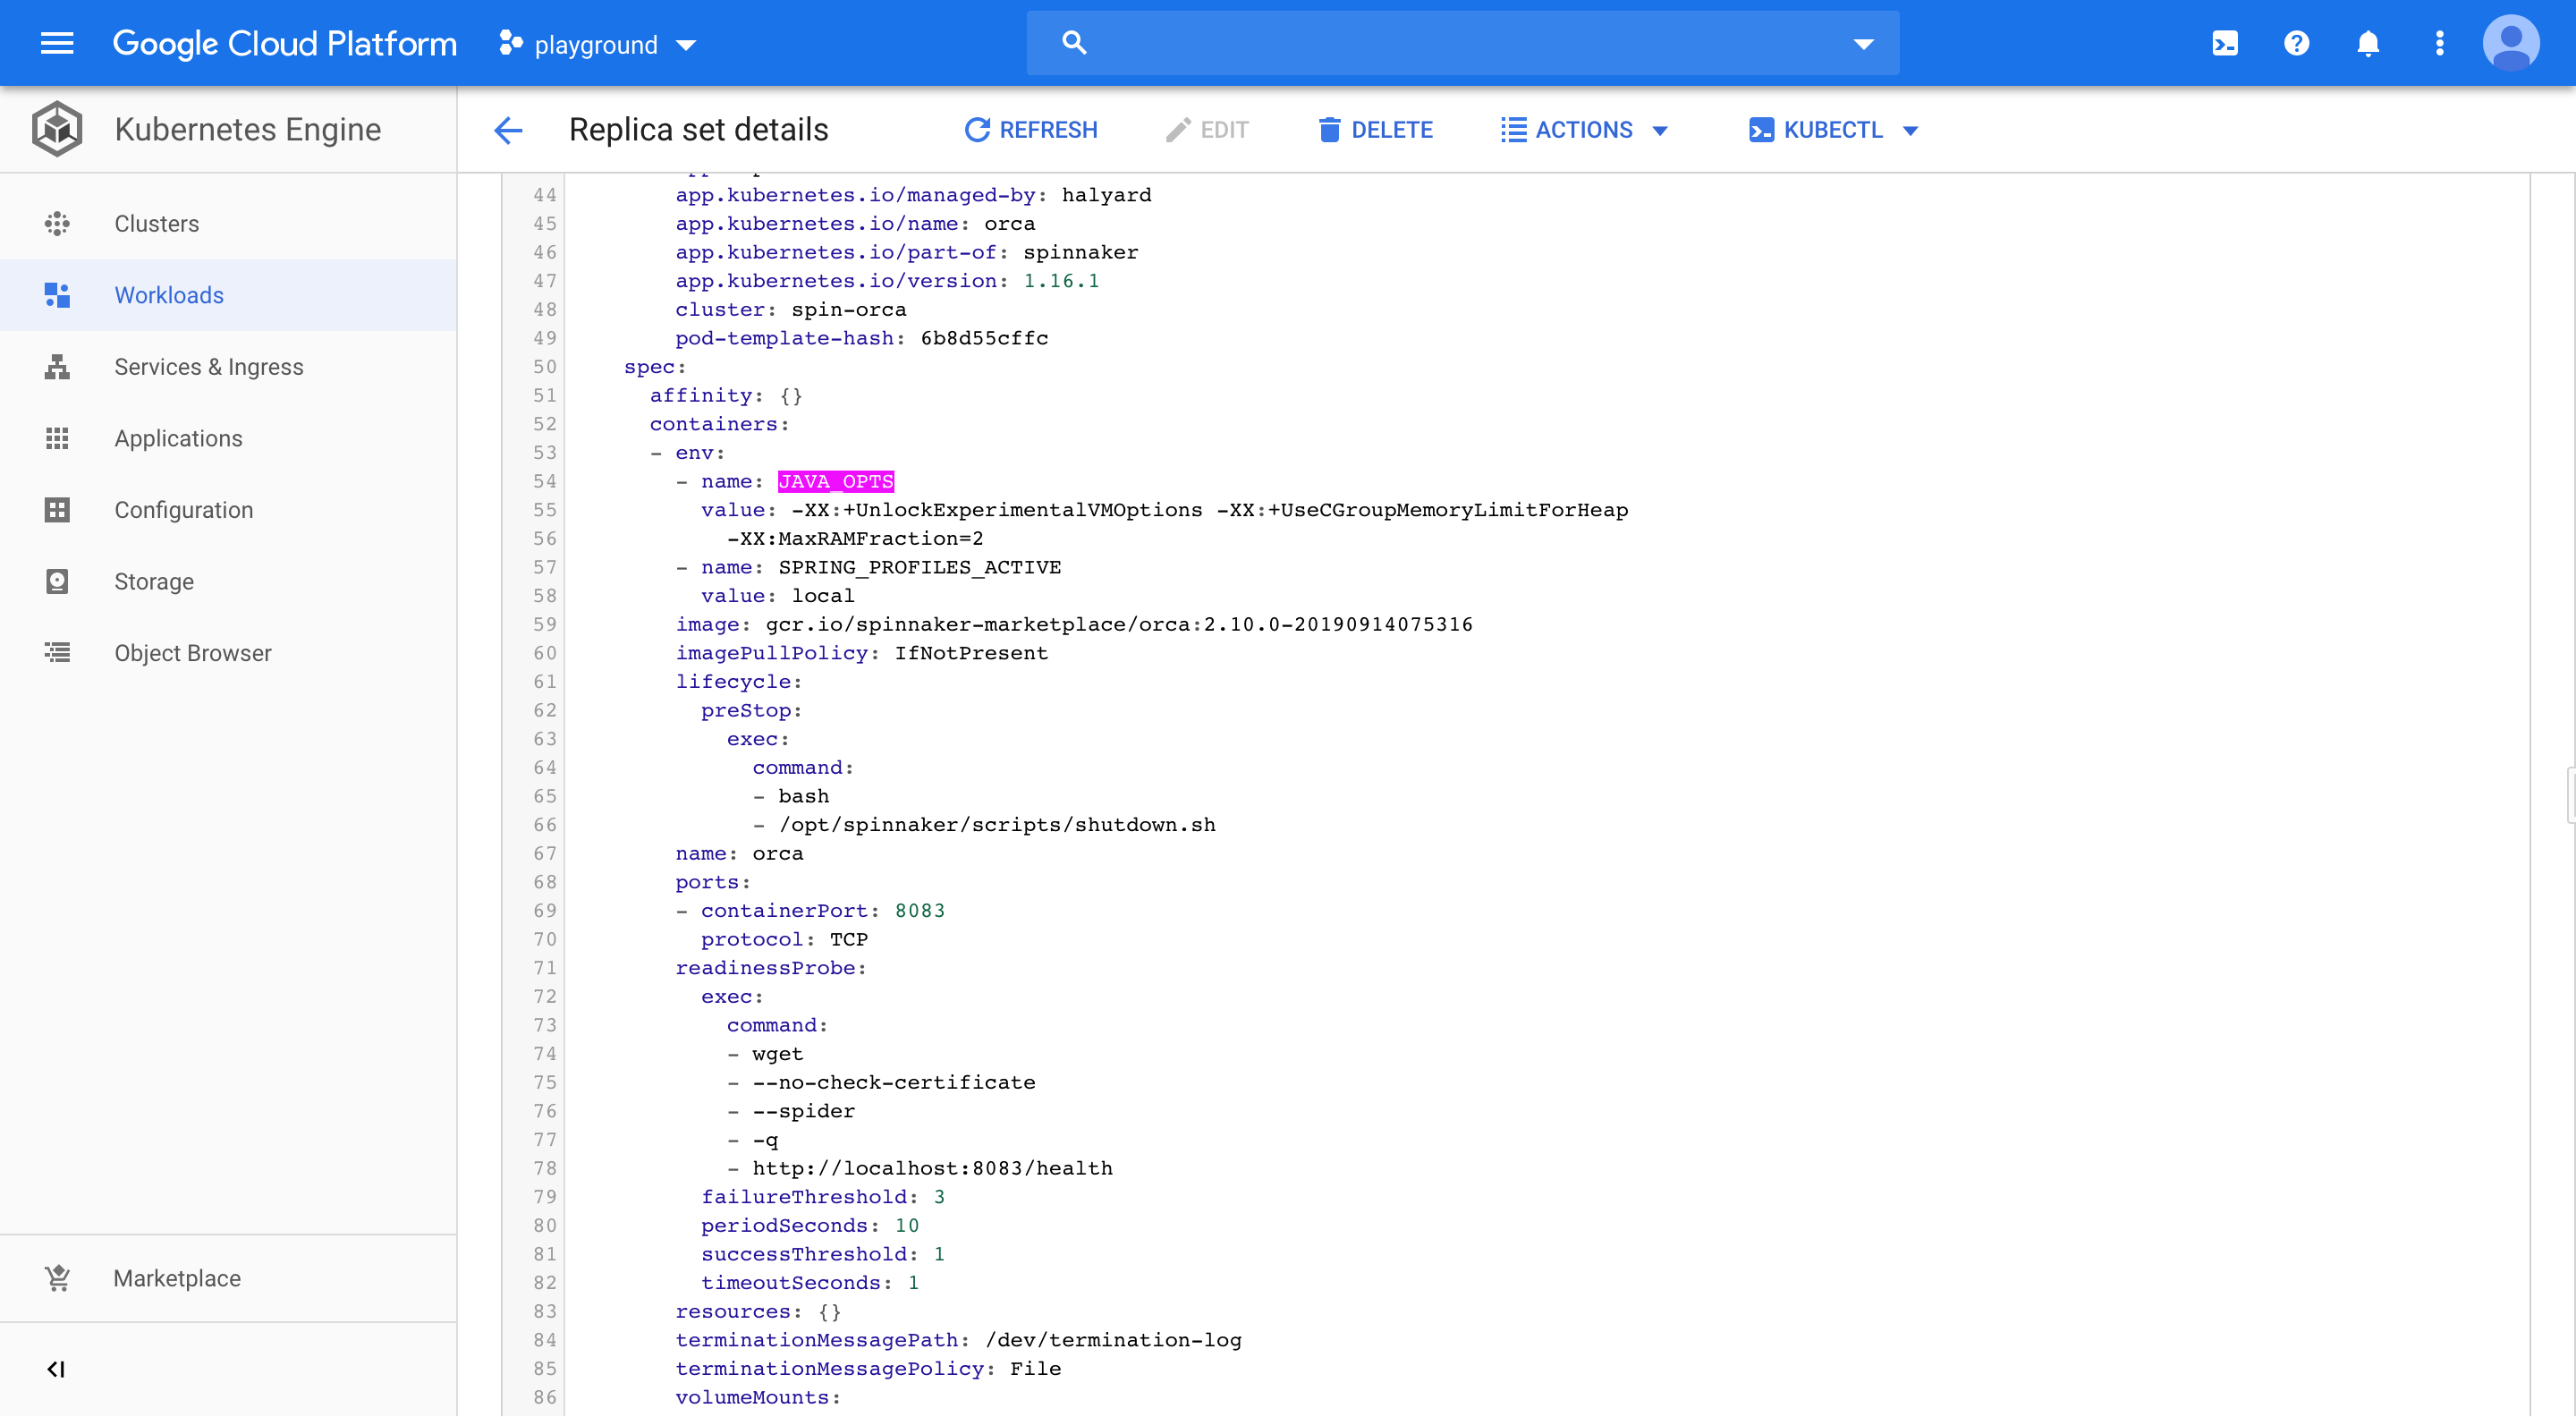
Find containers: line and add these two lines below it
- containerPort: 5005 protocol: TCP -
The final file should looks like the below image, beware of indentation, yaml files are very sensitive to formatting.
-
Save the file, It will stop the pod and will create the new one reflecting the change we just made which makes it ready to connect to through Intellij
-
-
CLI way
-
Run
kubectl get deployment spin-clouddriver --export -o yaml > deployment.yml -
Above command generates a clean deployment.yml file which you can apply changes explained in GUI steps, including adding jvm options and debug port 5005.
-
Save changes to deployment.yml file and run
kubectl apply -f deployment.ymlWait a few seconds for changes to get applied, and check the status of deployment using
kubectl rollout status -f deployment.yml
-
-
-
Port-forward pod’s 5005 port using this command to make it available to the outside world so that Intellij can connect to it.
-
Run
kubectl port-forward "$(kubectl get pods | grep -i clouddriver | awk '{print $1}')" 5005Please don’t stop the above command as it will block the terminal
If another process has occupied this port run
lsof -i:5005 | grep -i listento find the process.You can kill found process using it’s process id which is the number in second column of output.
This is a sample on my machine for a process occupying port #1080.

check-port-binding.png
Finally this one-liner will kill any process occupying 5005 port.
kill -9 "$(lsof -i:1080 | grep -i listen | awk '{print $2}')"
-
-
Open another terminal and Port-forward pod’s serving port, You may noticed it as you were adding debug port under ports > containerPort in yaml file, in this case it’s 7002.
- Run
kubectl port-forward "$(kubectl get pods | grep -i clouddriver | awk '{print $1}')" 7002
- Run
-
Open CloudDriver project locally using Intellij
-
Run
./gradlew ideain terminal to have a fully prepared Intellij Project. -
Add Configuration in the middle of top toolbar, Click it to add a new debug config.
Add a remote template and rename it to match your project e.g. CloudDriver K8S Debug.
Hit the debug button.
Notice “Connected to the target VM, address: ‘localhost:5005’, transport: ‘socket’" message in console at the end of video!
-
-
Open http://locahost:7002 in your browser and go through steps to reproduce the bug to pinpoint the bug’s root cause.
-
To find the right file putting breakpoints in and investigate the problem checkout k8s logs and find related class-names:
kubectl logs -f --tail=100 "$(kubectl get pods | grep -i clouddriver | awk '{print $1}')"These are couple of lines on my machine
INFO 1 --- [utionAction-415] s.c.k.v.c.a.KubernetesCacheDataConverter : default/KubernetesCoreCachingAgent[1/1]: grouping persistentVolumeClaim has 3 entries and 0 relationships
INFO 1 --- [utionAction-415] s.c.k.v.c.a.KubernetesCacheDataConverter : default/KubernetesCoreCachingAgent[1/1]: grouping job has 1 entries and 1 relationships
INFO 1 --- [utionAction-415] s.c.k.v.c.a.KubernetesCacheDataConverter : default/KubernetesCoreCachingAgent[1/1]: grouping mutatingWebhookConfiguration has 1 entries and 0 relationships
INFO 1 --- [utionAction-415] s.c.k.v.c.a.KubernetesCacheDataConverter : default/KubernetesCoreCachingAgent[1/1]: grouping clusters has 26 entries and 66 relationships
INFO 1 --- [utionAction-415] s.c.k.v.c.a.KubernetesCacheDataConverter : default/KubernetesCoreCachingAgent[1/1]: grouping deployment has 10 entries and 36 relationships
INFO 1 --- [utionAction-415] s.c.k.v.c.a.KubernetesCacheDataConverter : default/KubernetesCoreCachingAgent[1/1]: grouping applications has 4 entries and 66 relationships
INFO 1 --- [utionAction-414] s.c.k.v.c.a.KubernetesCacheDataConverter : default/KubernetesUnregisteredCustomResourceCachingAgent[1/1]: grouping StorageVersionMigration.migration.k8s.io has 54 entries and 0 relationships
INFO 1 --- [utionAction-414] s.c.k.v.c.a.KubernetesCacheDataConverter : default/KubernetesUnregisteredCustomResourceCachingAgent[1/1]: grouping StorageState.migration.k8s.io has 54 entries and 0 relationships
The class generating these log lines is
KubernetesCacheDataConverter, so go find that file in the project(or project dependencies) and search for a part of log message printed out to find the exact line of code generating it.You can see the final steps in action:
-
-
🎉 🎊🎉 Hooray!!!
Have fun and happy debugging!